

A Short History of Rust Skins, From Timed Drops to Today
From the first Steam inventory drops in 2015 to the weekly store, permanent store, Twitch drops and Premium servers: how Rust's skin economy took shape.

Rust skin prices, market cap and movers across Steam and third-party markets. Data from RustSkins.gg.
+53.0% over the past year
24-hour changes. Items under $0.50 and moves above 500% are filtered out.
| # | Item | Steam price | Est. supply | Market cap |
|---|---|---|---|---|
| 1 |  Forest Raiders Roadsign Pants | $84.57 | 29.4K | $2.49M |
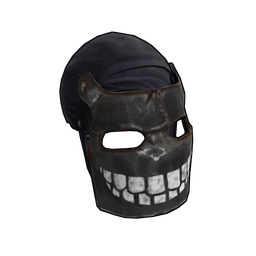
| 2 |  Big Grin | $1,150.00 | 1,465 | $1.68M |
| 3 |  Whiteout Hoodie | $20.08 | 82.1K | $1.65M |
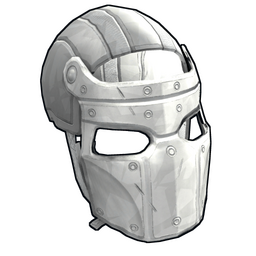
| 4 |  Whiteout Facemask | $21.05 | 77.6K | $1.63M |
| 5 |  Whiteout Kilt | $22.34 | 64.7K | $1.45M |
| 6 |  Forest Raiders Roadsign Vest | $55.85 | 23.9K | $1.34M |
| 7 |  Desert Raiders Facemask | $73.00 | 18.3K | $1.34M |
| 8 |  Whiteout Helmet | $39.49 | 31.7K | $1.25M |
| 9 |  Forest Raiders Helmet | $51.37 | 22.6K | $1.16M |
| 10 |  Forest Raiders Pants | $35.13 | 29.5K | $1.04M |
From the first Steam inventory drops in 2015 to the weekly store, permanent store, Twitch drops and Premium servers: how Rust's skin economy took shape.
How Rust's weekly limited store, the permanent store and the post-purchase hold fit together, with real prices from last week's set as of October 14, 2026.
A step-by-step way to price any Rust skin using Steam's ask and bid, third-party listings, listing depth, freshness and fees, worked through with live data.
How glowing Rust skins use emission maps, why they don't light your base, and where animated skins fit in, with live prices as of October 14, 2026.
How to read Steam listings, buy orders and estimated supply for Rust skins, and what the ratios between them reveal, using live data from October 14, 2026.
A map of Rust's skin categories, from clothing and weapons to doors, boxes and furnaces, with how much of the market each holds as of October 14, 2026.
Rust skin prices, market cap and movers across Steam and third-party markets.